From 40% Dropout to Engaged Learners, Redesigning Voluntary Upskilling
A self-initiated project to redesign a failing voluntary learning program at ExxonMobil, applying behavioral science, gamification, and research to build a scalable upskilling framework from scratch, with zero budget and no team.
A 40% dropout rate was a signal, not just a number
A voluntary design upskilling program at ExxonMobil Buenos Aires was failing to retain participants. 40% dropped out, despite having volunteered to join. The problem was not lack of interest but a program that ignored how people actually behave under real-world constraints: heavy workloads, unclear expectations, fear of sharing unfinished work, and no visible sense of progress.
As Design Community Lead, I identified this as a systemic design problem, not a motivation problem. I stepped away from day-to-day community leadership to dedicate myself fully to redesigning the learning experience from scratch. No budget, no dedicated platform, no team.
The program was delivered entirely in PowerPoint, the only tool accessible to all participants across corporate laptop restrictions. All visual assets, iconography, and curated external materials were created from scratch and verified for access from corporate devices.
This project has two distinct parts: a research and design process documented in dedicated process artifacts, and the final PowerPoint program delivered to participants. The two visual styles reflect these two separate workstreams.
Understanding why motivated people still quit
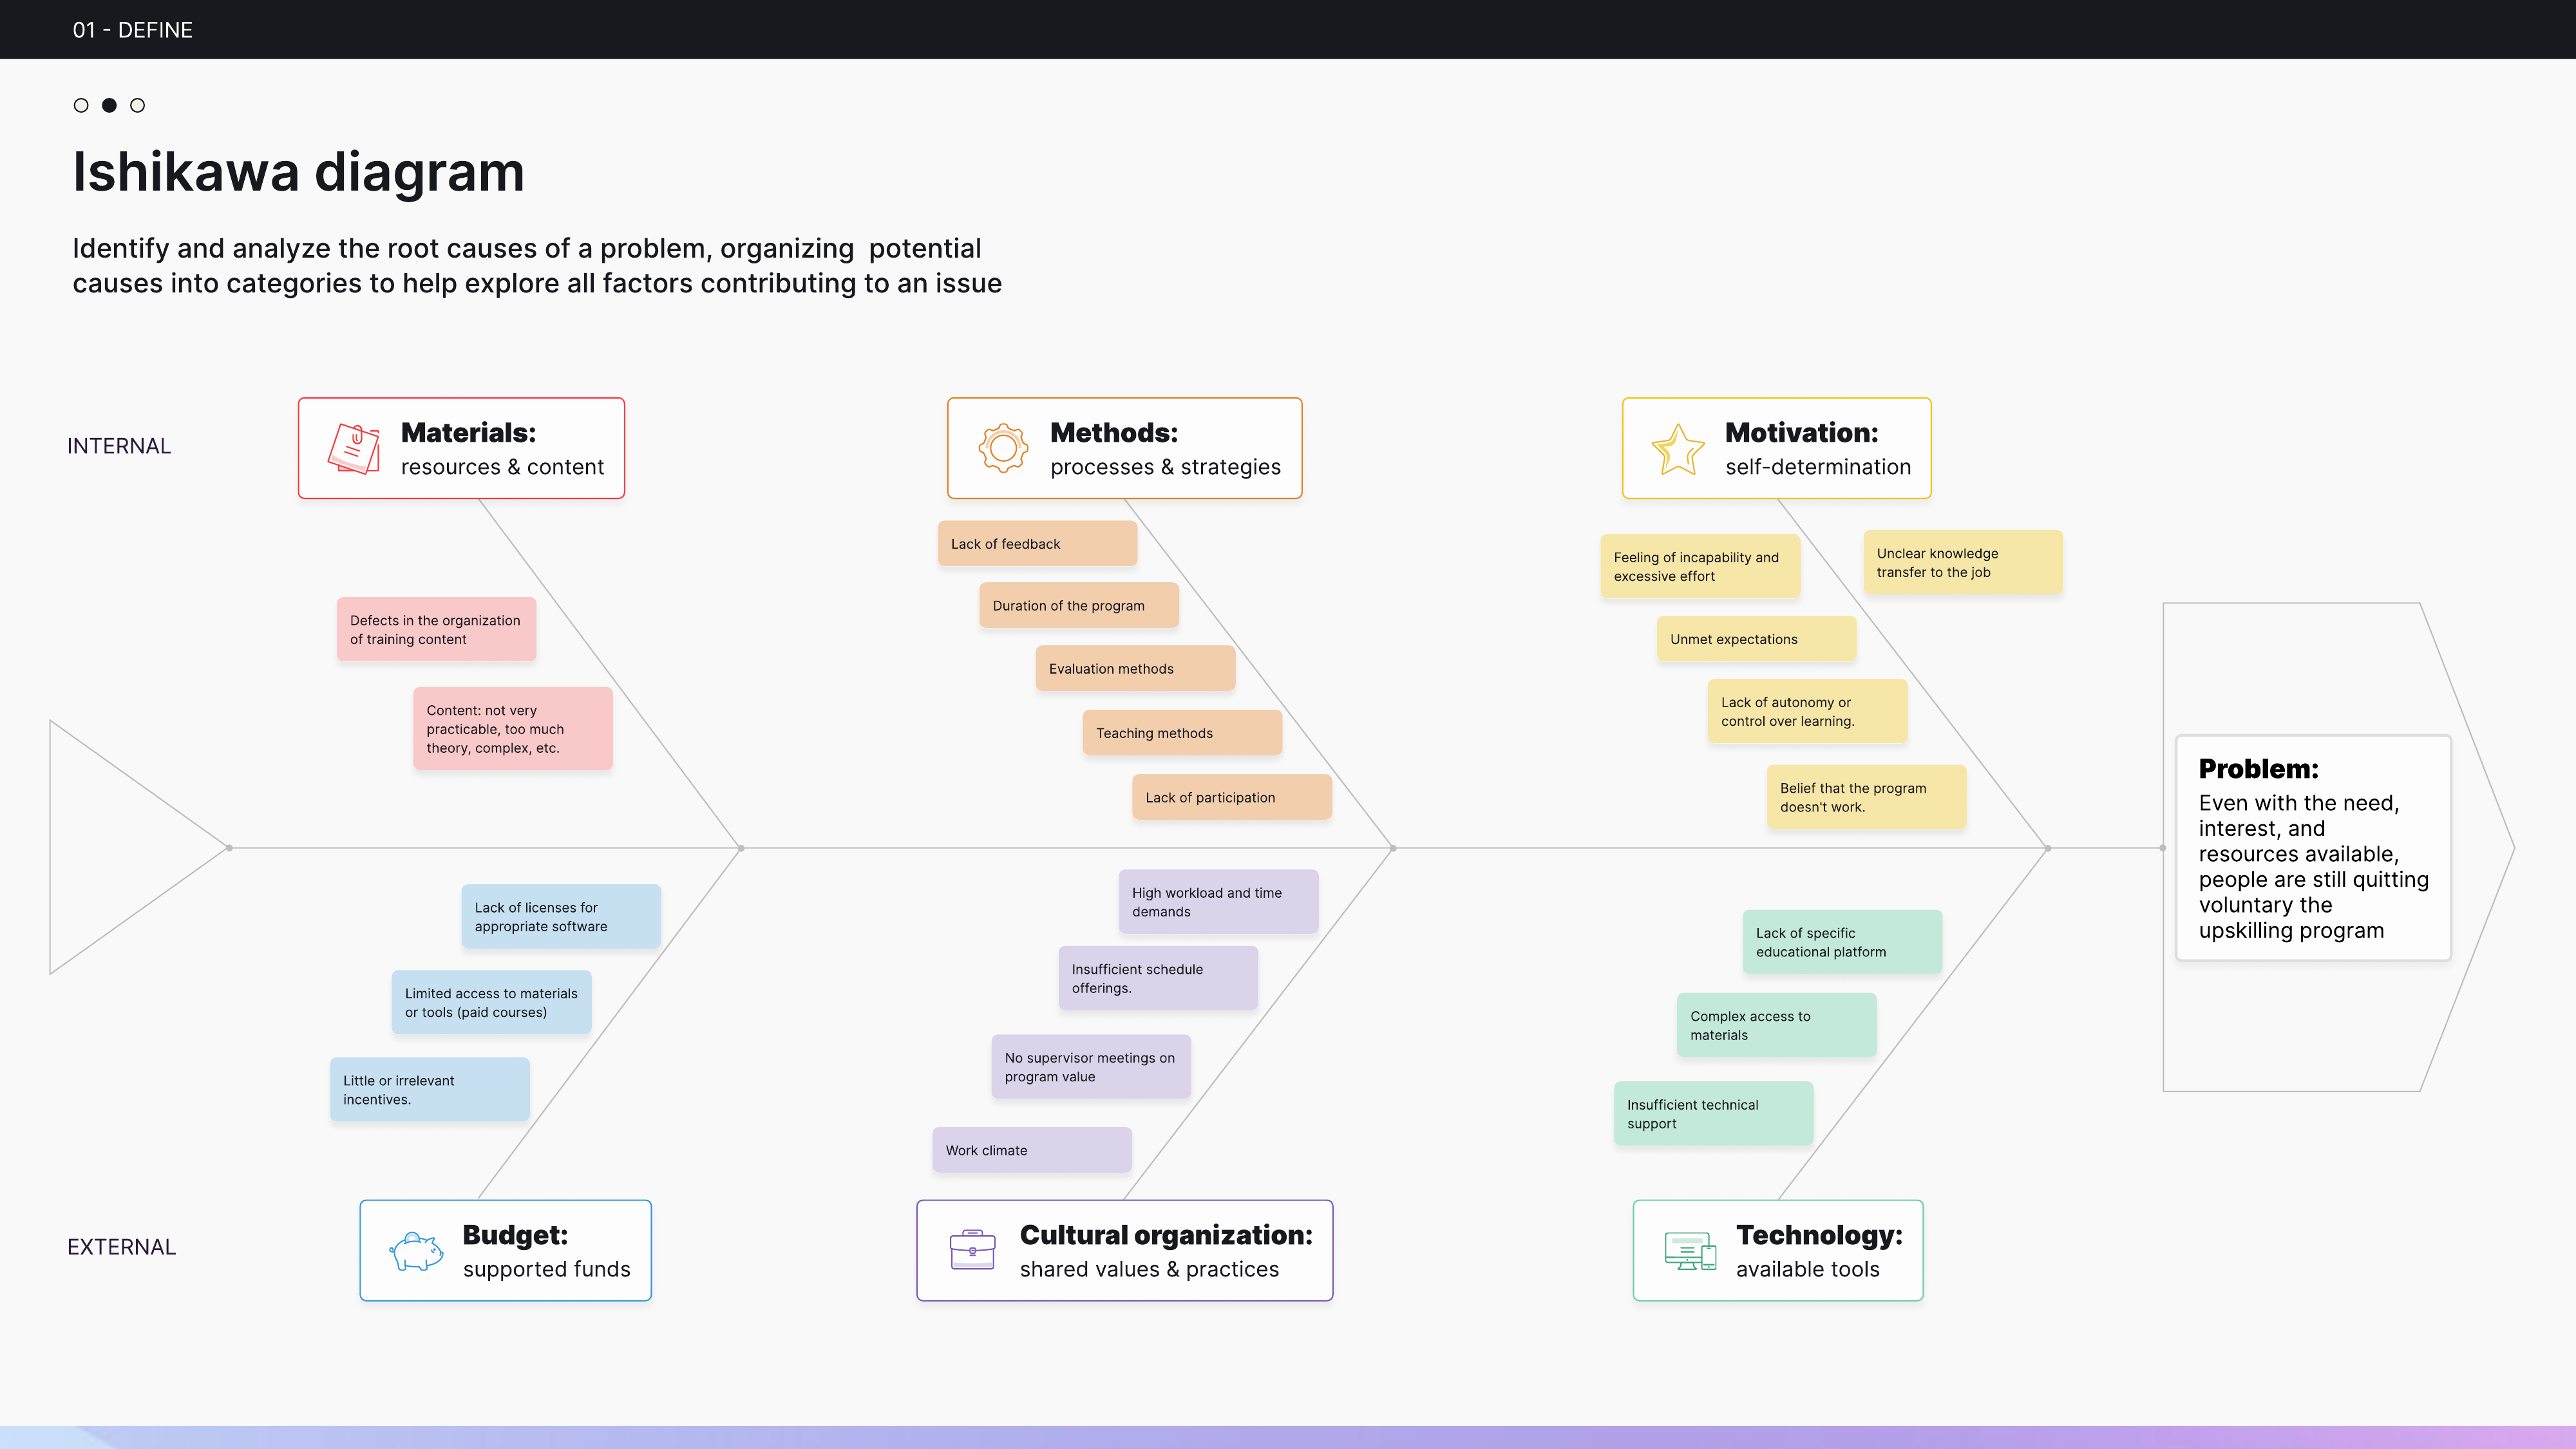
Root cause analysis — why motivated people still quit. Ishikawa diagram mapping the causes of dropout across six dimensions: materials, methods, motivation, budget, organizational culture, and technology. The consistent finding was that dropout was not a motivation problem but a systems problem. Time pressure, invisible progress, fear of sharing unfinished work, and lack of supervisor involvement were the real drivers. This diagnosis shaped every design decision that followed.
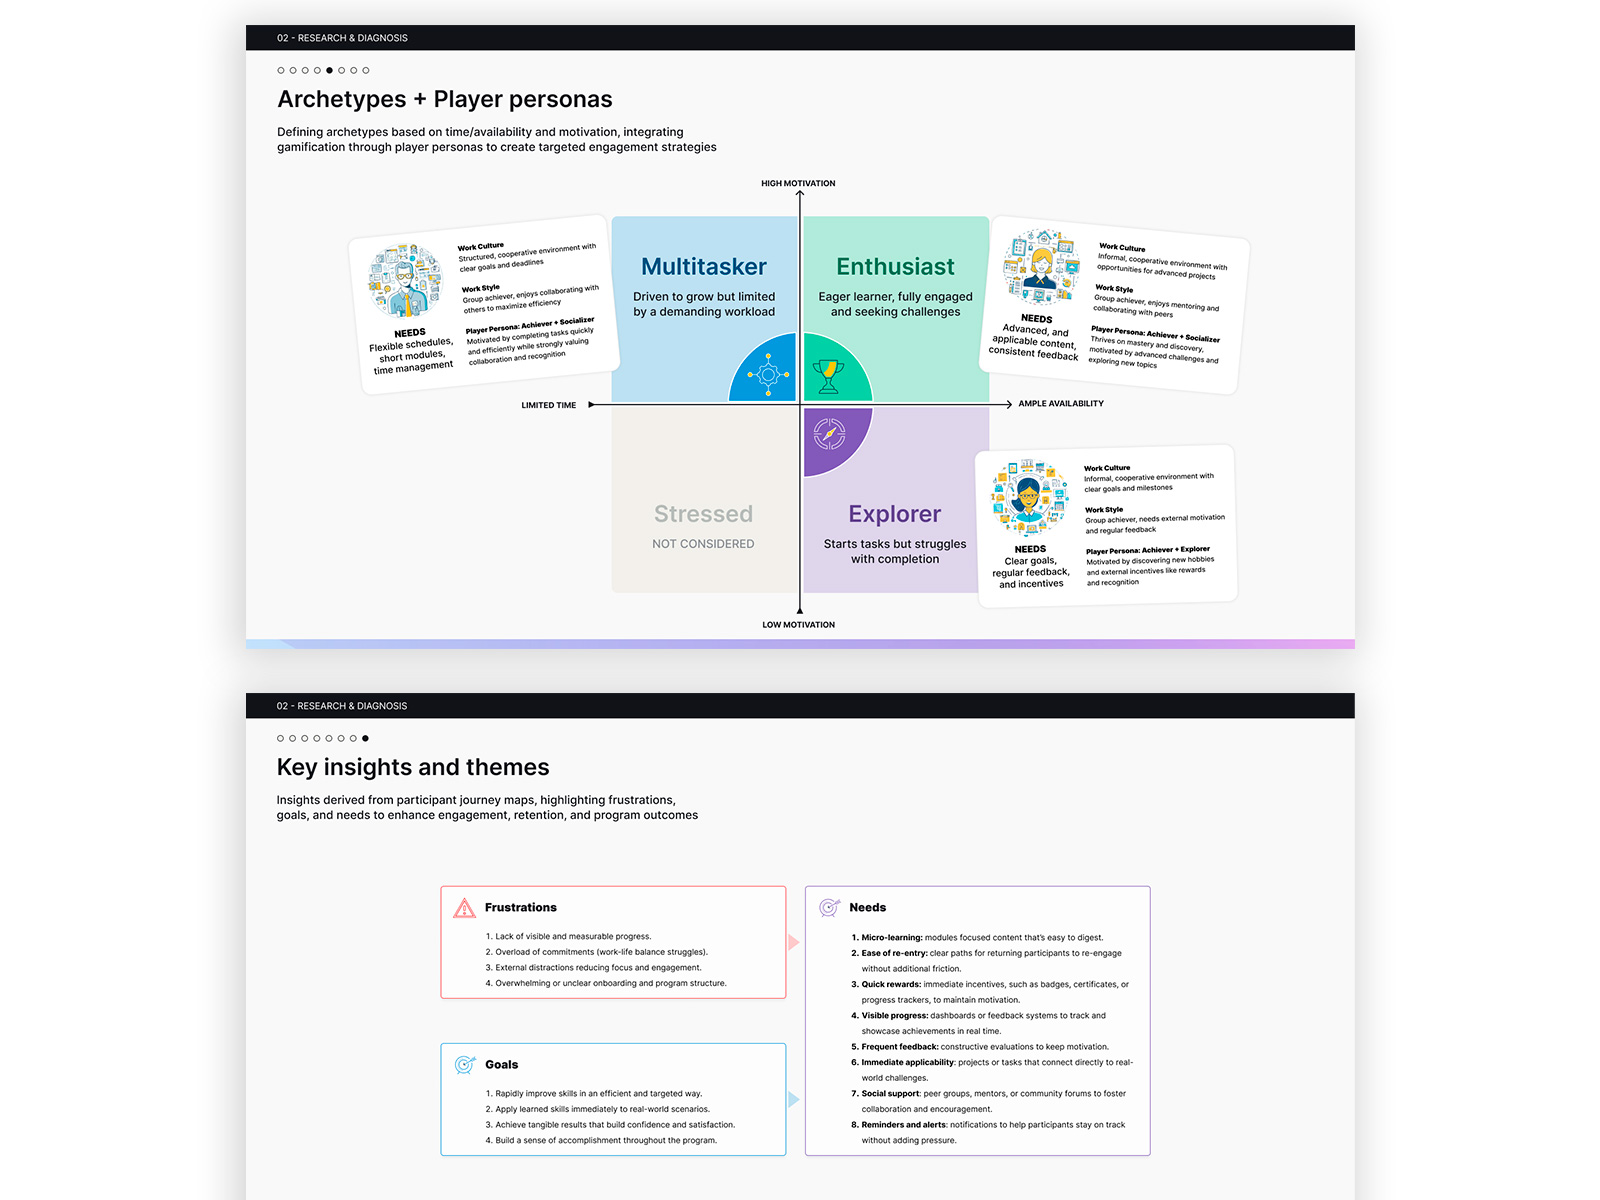
Research synthesis — archetypes and key insights. Behavioral archetypes mapped to Bartle's Player Types across two axes, motivation and time availability, identifying three participant profiles: Multitasker, Enthusiast, and Explorer. Each archetype required a different engagement strategy. Key insights from journey maps distilled the core frustrations, goals, and needs that the program redesign had to address. These two tools translated raw research into actionable design decisions.
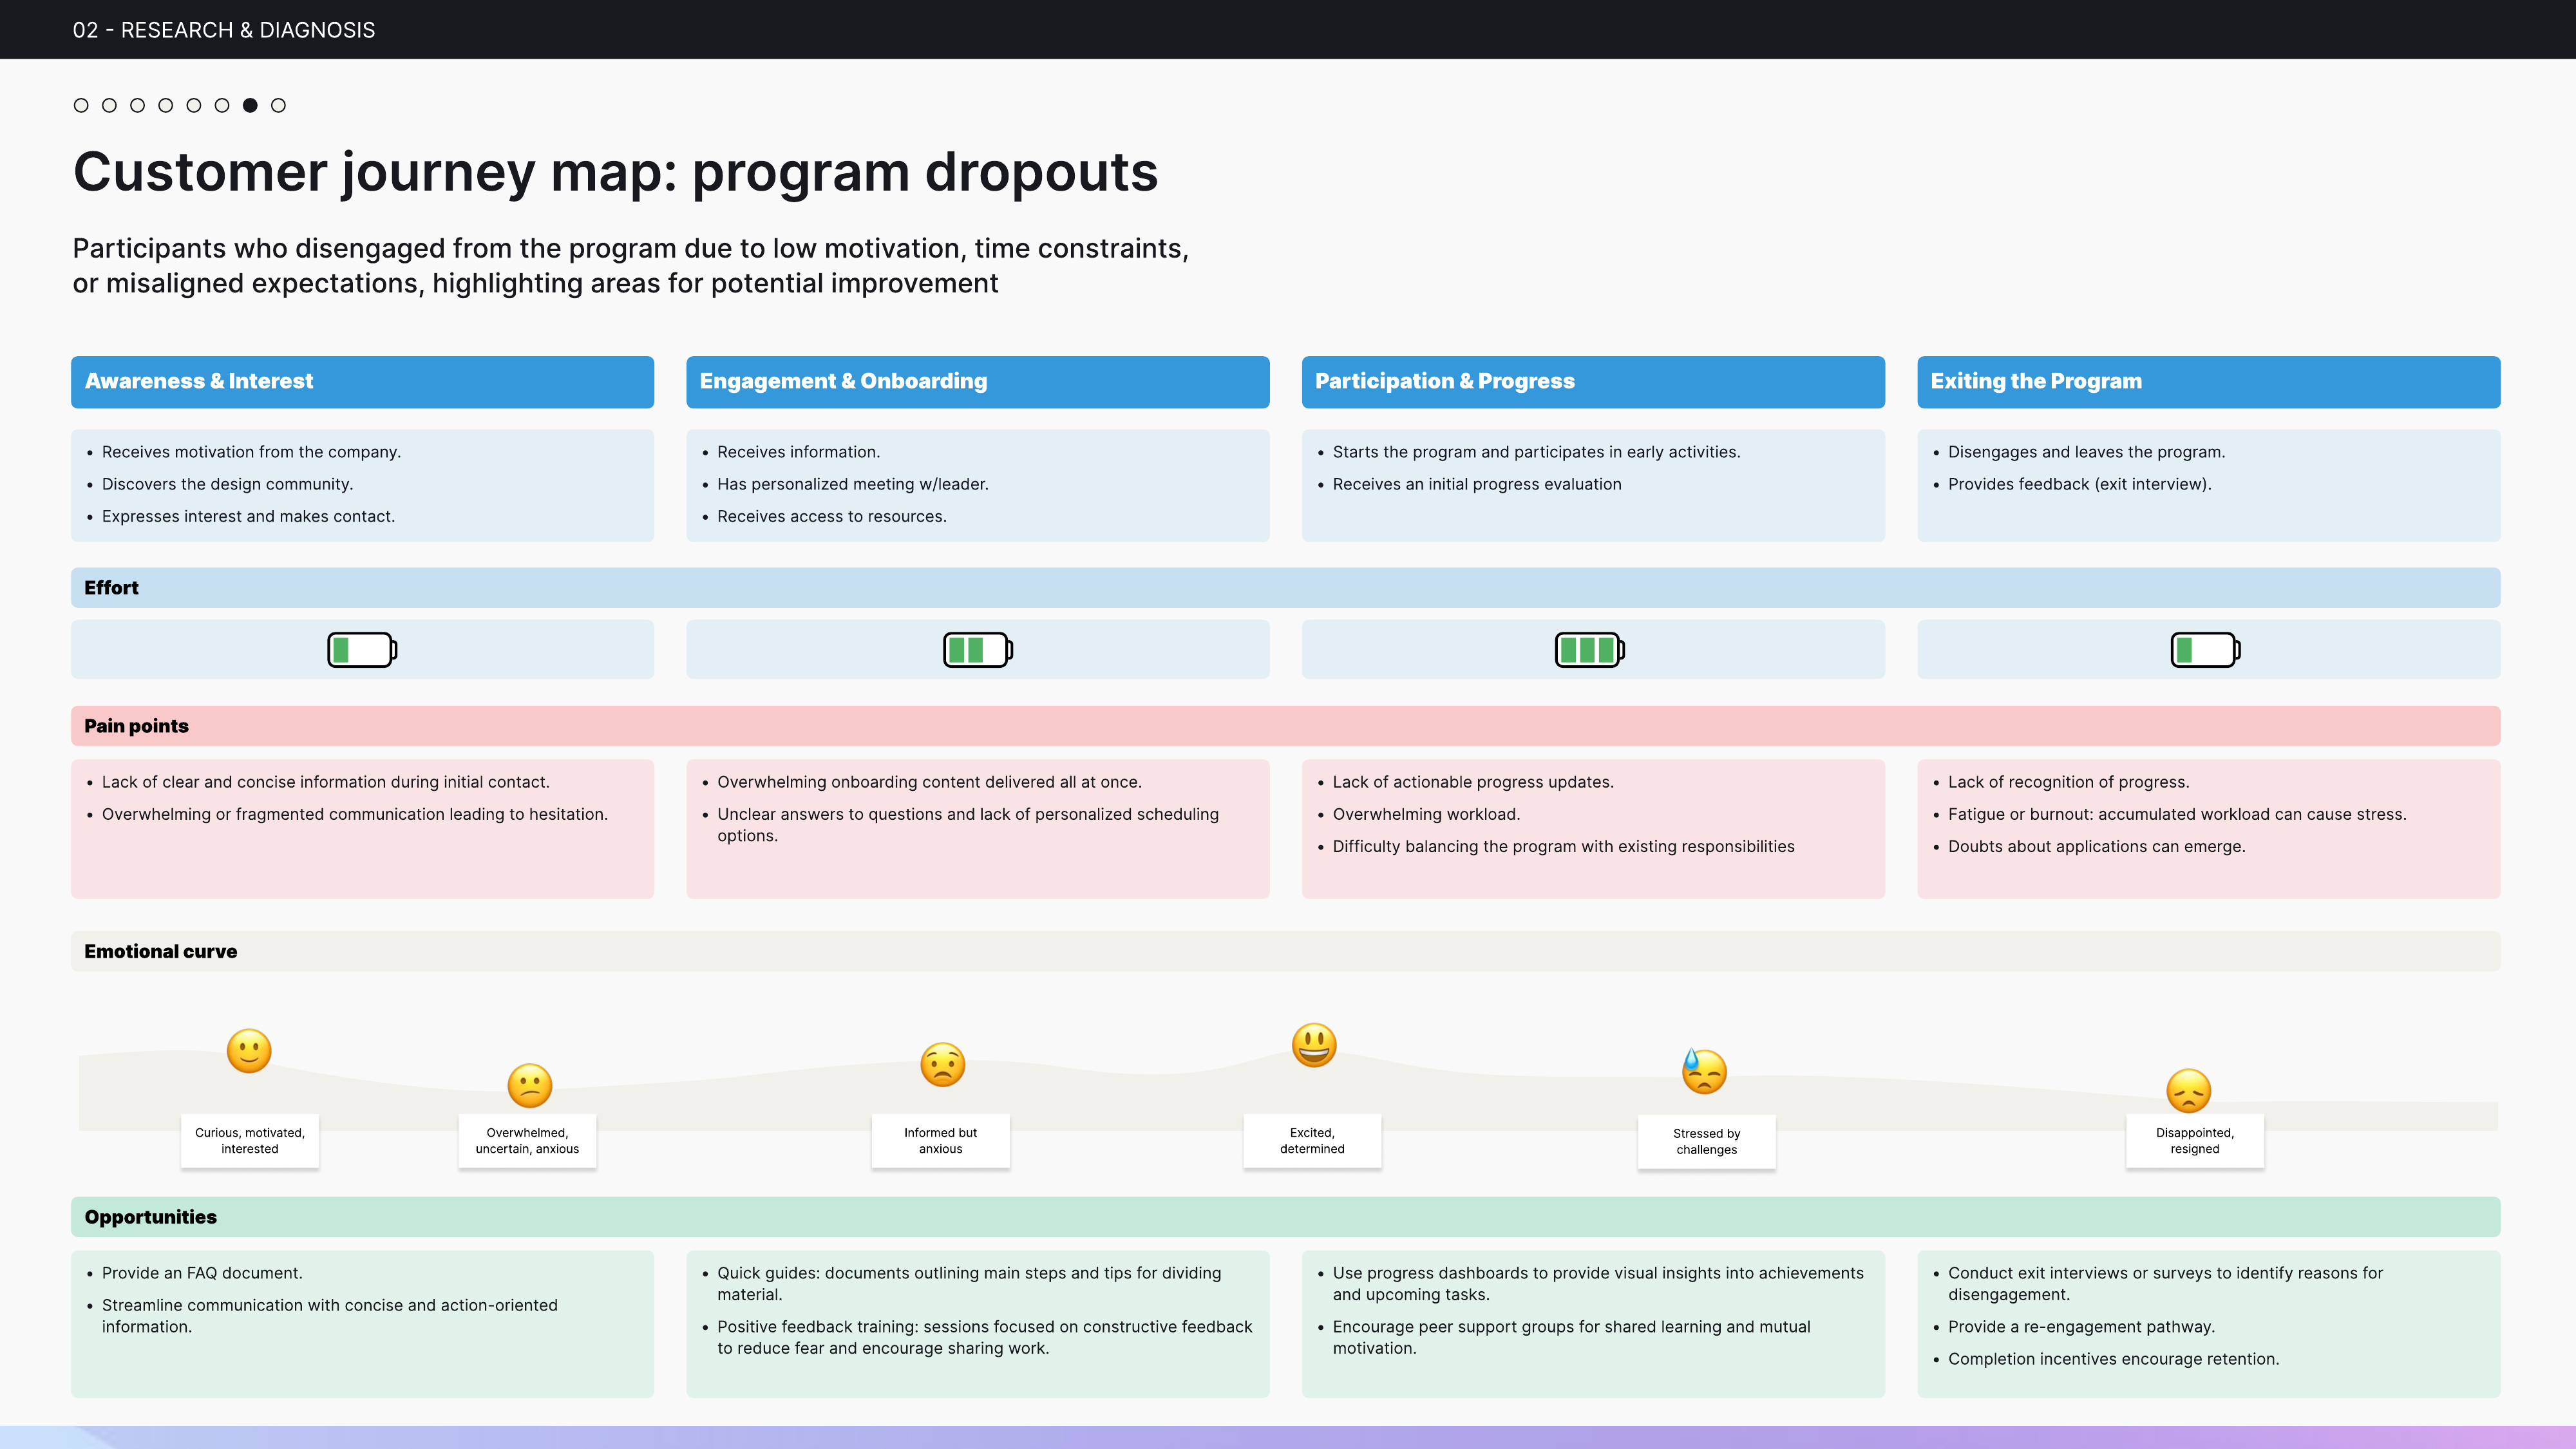
Journey map — from curiosity to resignation. Journey map tracing the emotional arc of participants who dropped out across four stages: Awareness, Onboarding, Participation, and Exit. The map surfaces the exact moments where motivation collapsed: overwhelming onboarding content, lack of actionable progress updates, and accumulated workload fatigue. Each pain point became a direct intervention target in the program redesign.
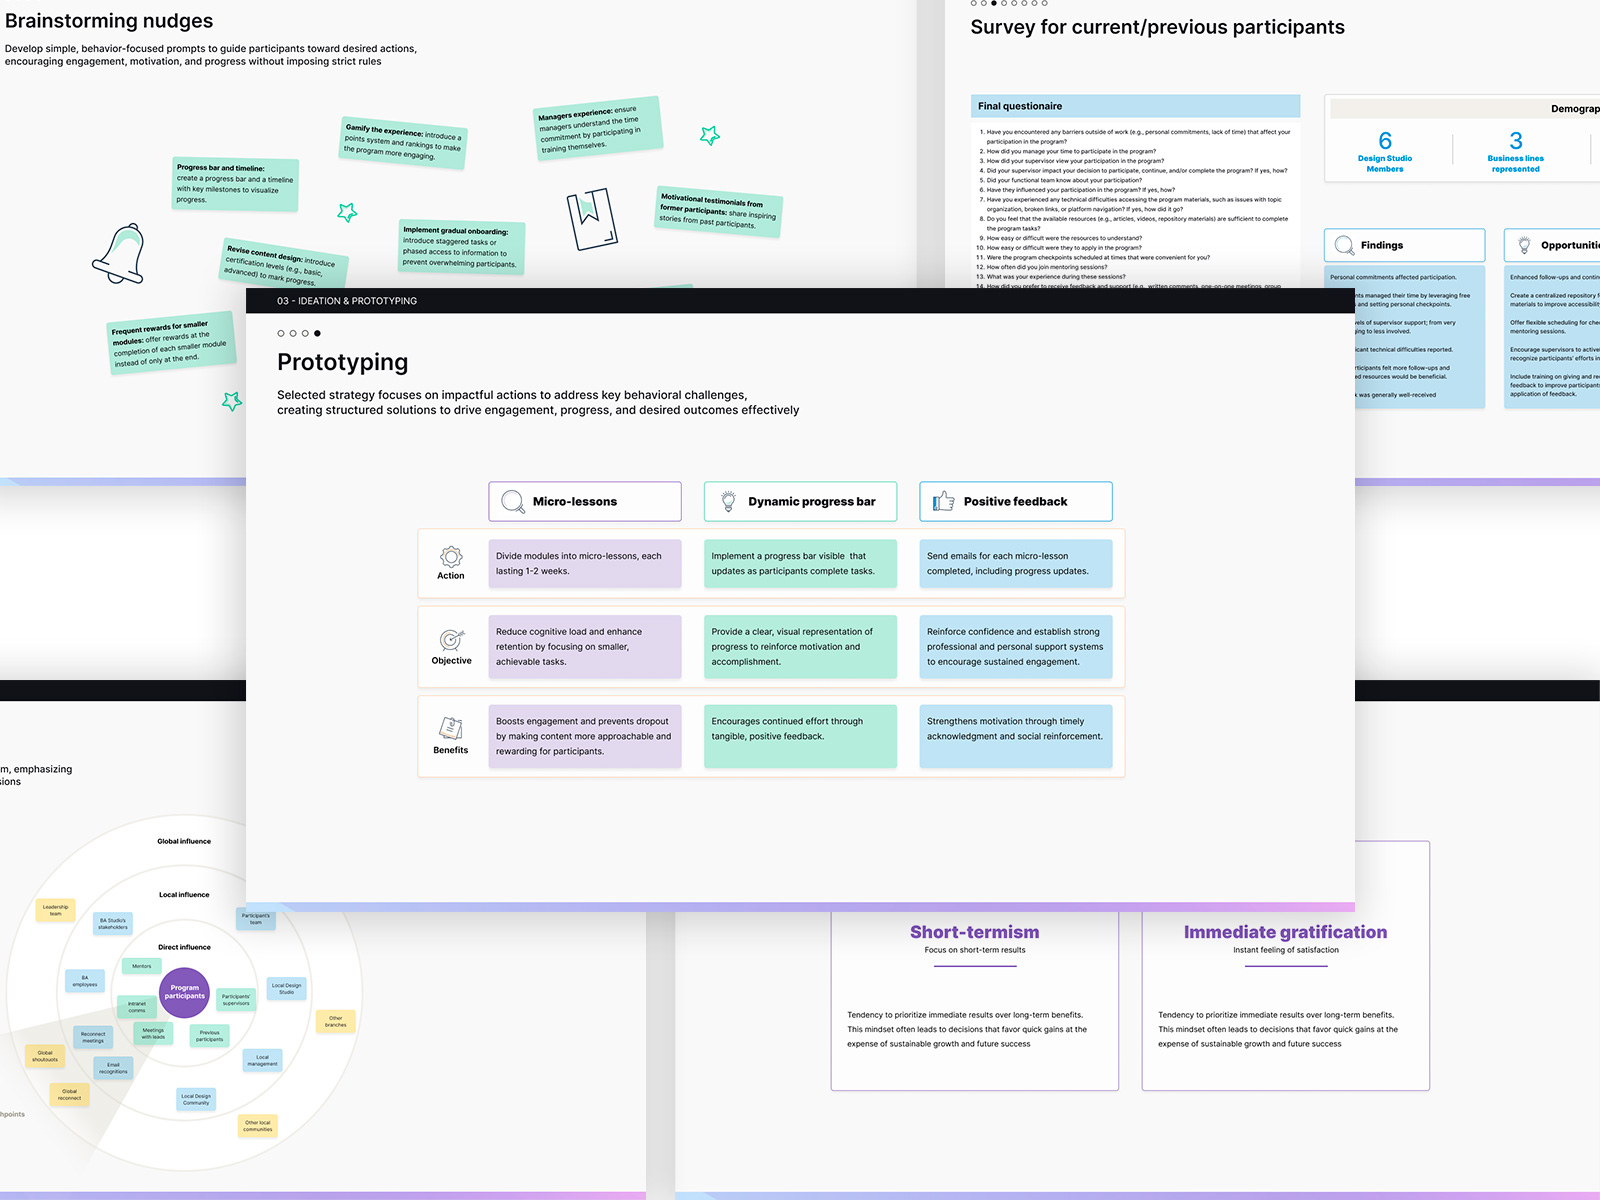
From ideation to intervention — the design process. The prototyping stage at the center, surrounded by four process artifacts: brainstorming nudges, current participant interviews, intervention chosen, and actor mapping. The chosen intervention was immediate gratification: making small wins visible and meaningful at every step rather than rewarding only final completion.
Using AI to accelerate research, ideation, and visual exploration
Because Microsoft Copilot was the only AI tool available within ExxonMobil’s enterprise environment, it became part of the process at different stages of the project.
During research preparation, I used AI to simulate interview responses and test early assumptions before speaking with real participants. This helped refine the interview guide, uncover blind spots, and arrive at sessions with more focused questions.
During ideation, AI was used to rapidly explore and challenge intervention concepts, helping surface edge cases and accelerate decision-making before moving into synthesis and validation.
Adobe Illustrator’s AI features were also used during visual exploration to generate and iterate on directions for the program’s identity system. The outputs were refined, combined, and adapted into the final visual language.
Throughout the project, AI supported exploration and speed, while design judgment, empathy, and decision-making remained entirely human.
Choices grounded in behavioral science
The research showed that time pressure and cognitive overload were the primary drivers of dropout, not disinterest. Breaking content into short, focused micro-lessons made participation compatible with demanding work schedules and reduced the activation energy needed to engage.
Journey mapping revealed that participants lost motivation when progress felt invisible. A system of points (runes), badges, and a dynamic progress bar was designed to provide continuous positive reinforcement, rewarding each micro-lesson completion rather than only the final outcome.
Surveys showed that supervisor involvement significantly impacted participant retention. Recognition emails were sent to both participants and their supervisors at key milestones, creating social reinforcement and making the program visible to the people with the most influence over participants' time and motivation.
Fear of critique was one of the most consistent barriers identified in interviews. Bi-weekly group checkpoints and a dedicated mini-workshop on constructive feedback were built into the program structure as core scaffolding to make sharing work feel safe enough to sustain engagement over time.
The delivered program — visual system and gamification
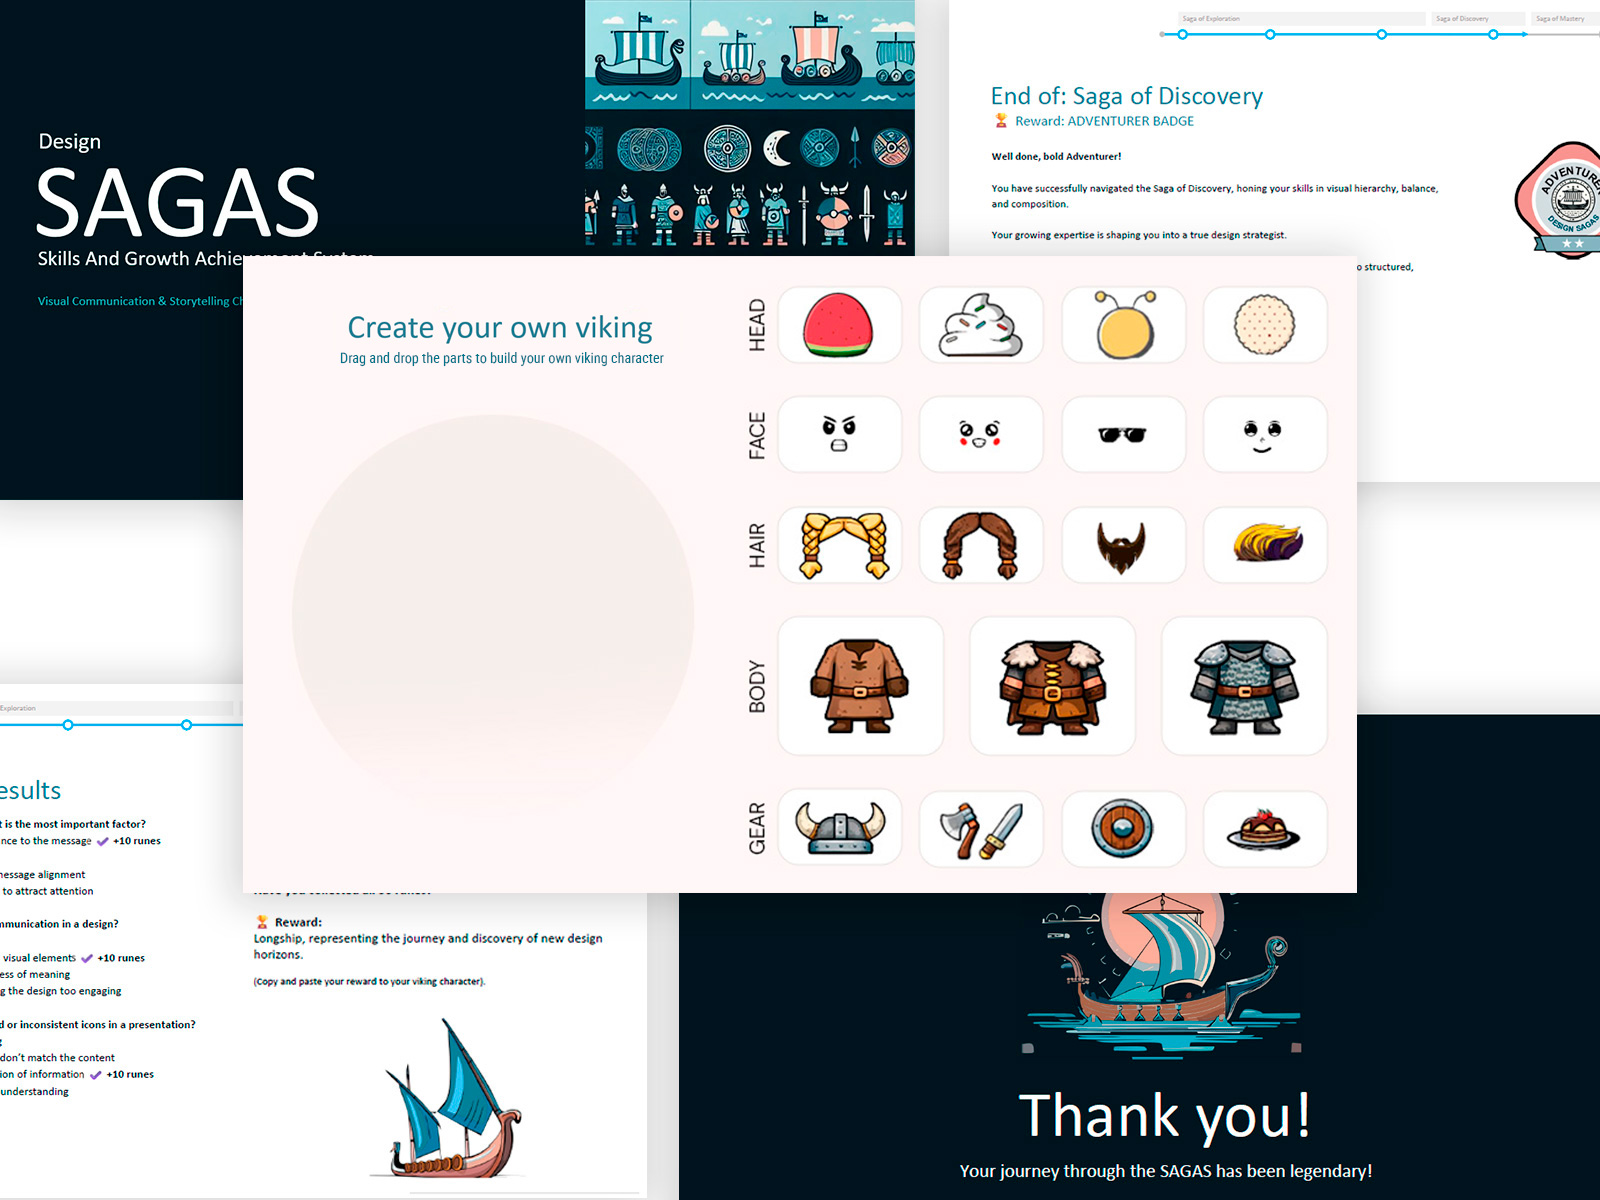
Visual system — iconography, character, and rewards. A selection of slides from the Design SAGAS PowerPoint program showing the visual system as implemented. All iconography, illustrations, and storytelling assets were created from scratch. Participants build a customizable Viking character by dragging and combining parts. Each completed module unlocks a themed reward tied to the learning content: a sun compass for navigation, a Viking helmet for mastery, a ship to keep sailing. Completing a full Saga earns a badge, sent alongside a recognition email copied to the participant's supervisor. The visual language of Nordic sagas was chosen deliberately to frame learning as an epic journey rather than a corporate training program.
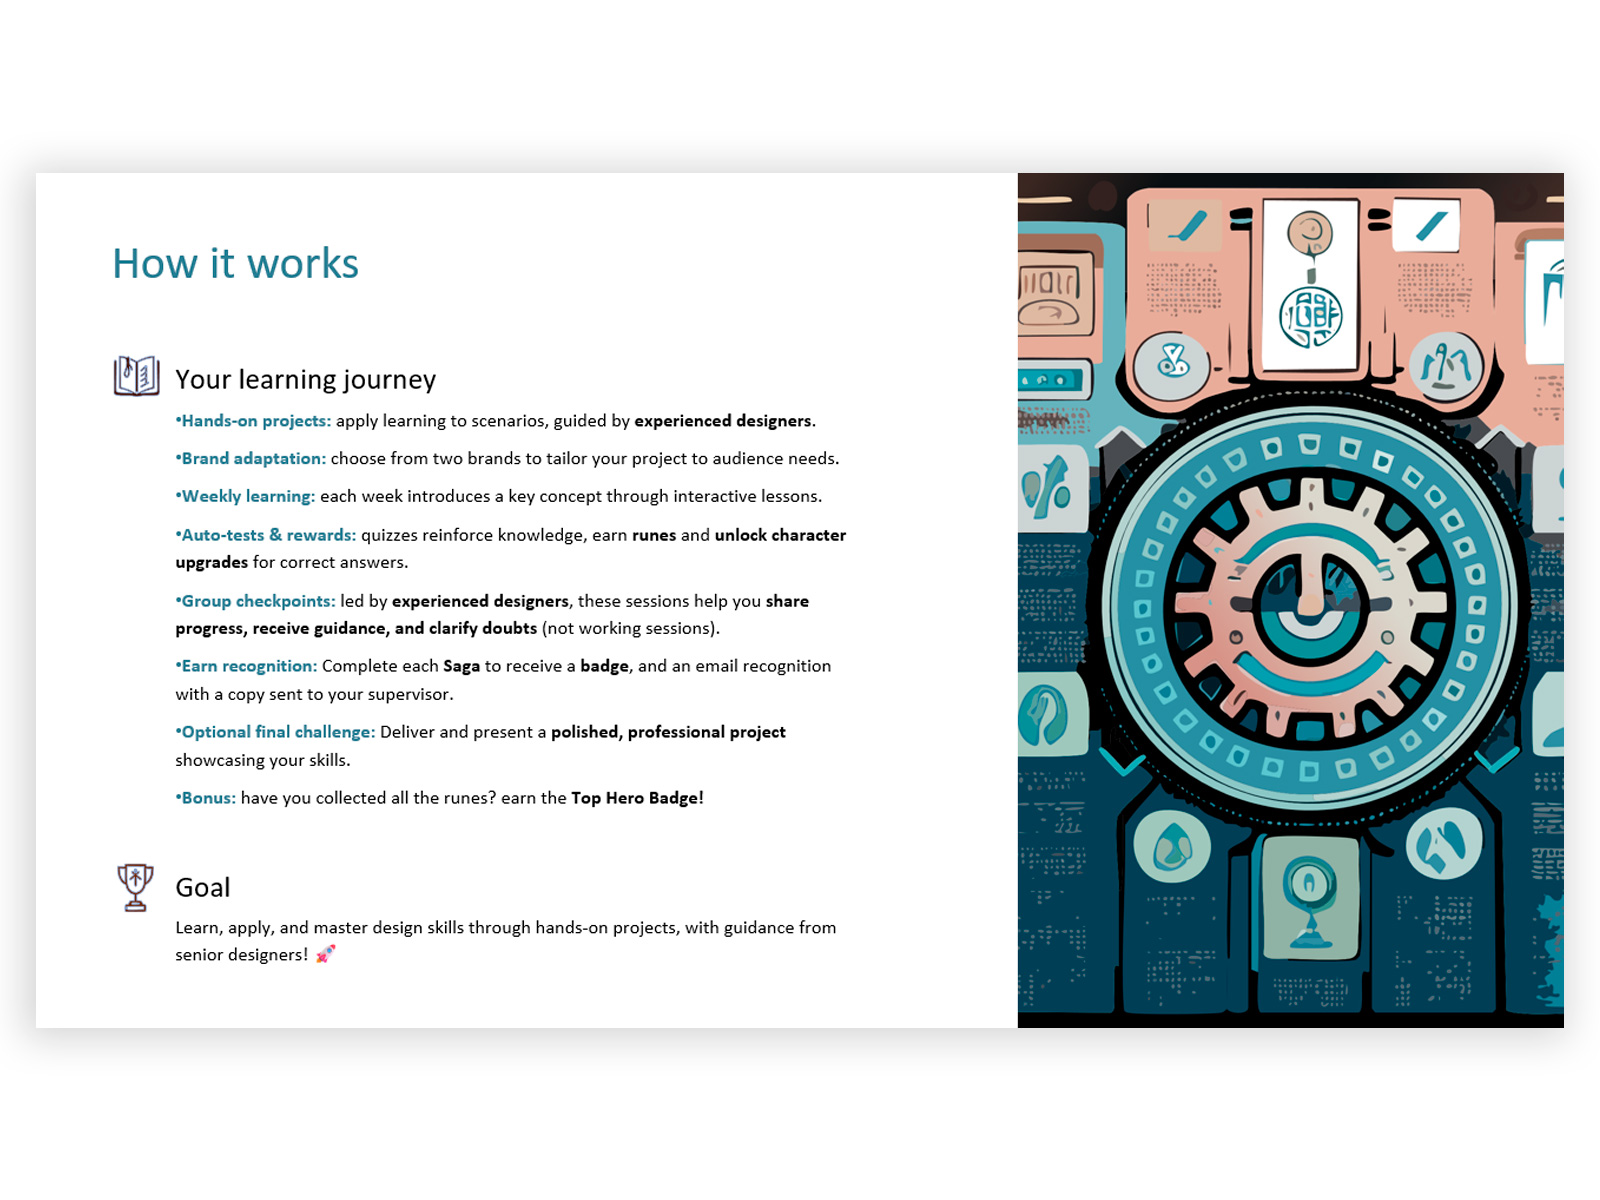
Program structure — onboarding documentation for participants. Onboarding slide created for participants to understand the full learning journey before starting: hands-on projects, weekly lessons, auto-tests earning runes, group checkpoints led by senior designers, badges and supervisor recognition emails at each completed Saga, and an optional final challenge. Every element was designed to address a specific barrier identified in research: micro-lessons for time pressure, checkpoints for fear of sharing, supervisor emails for social reinforcement, and the Top Hero Badge for those who collected all runes.
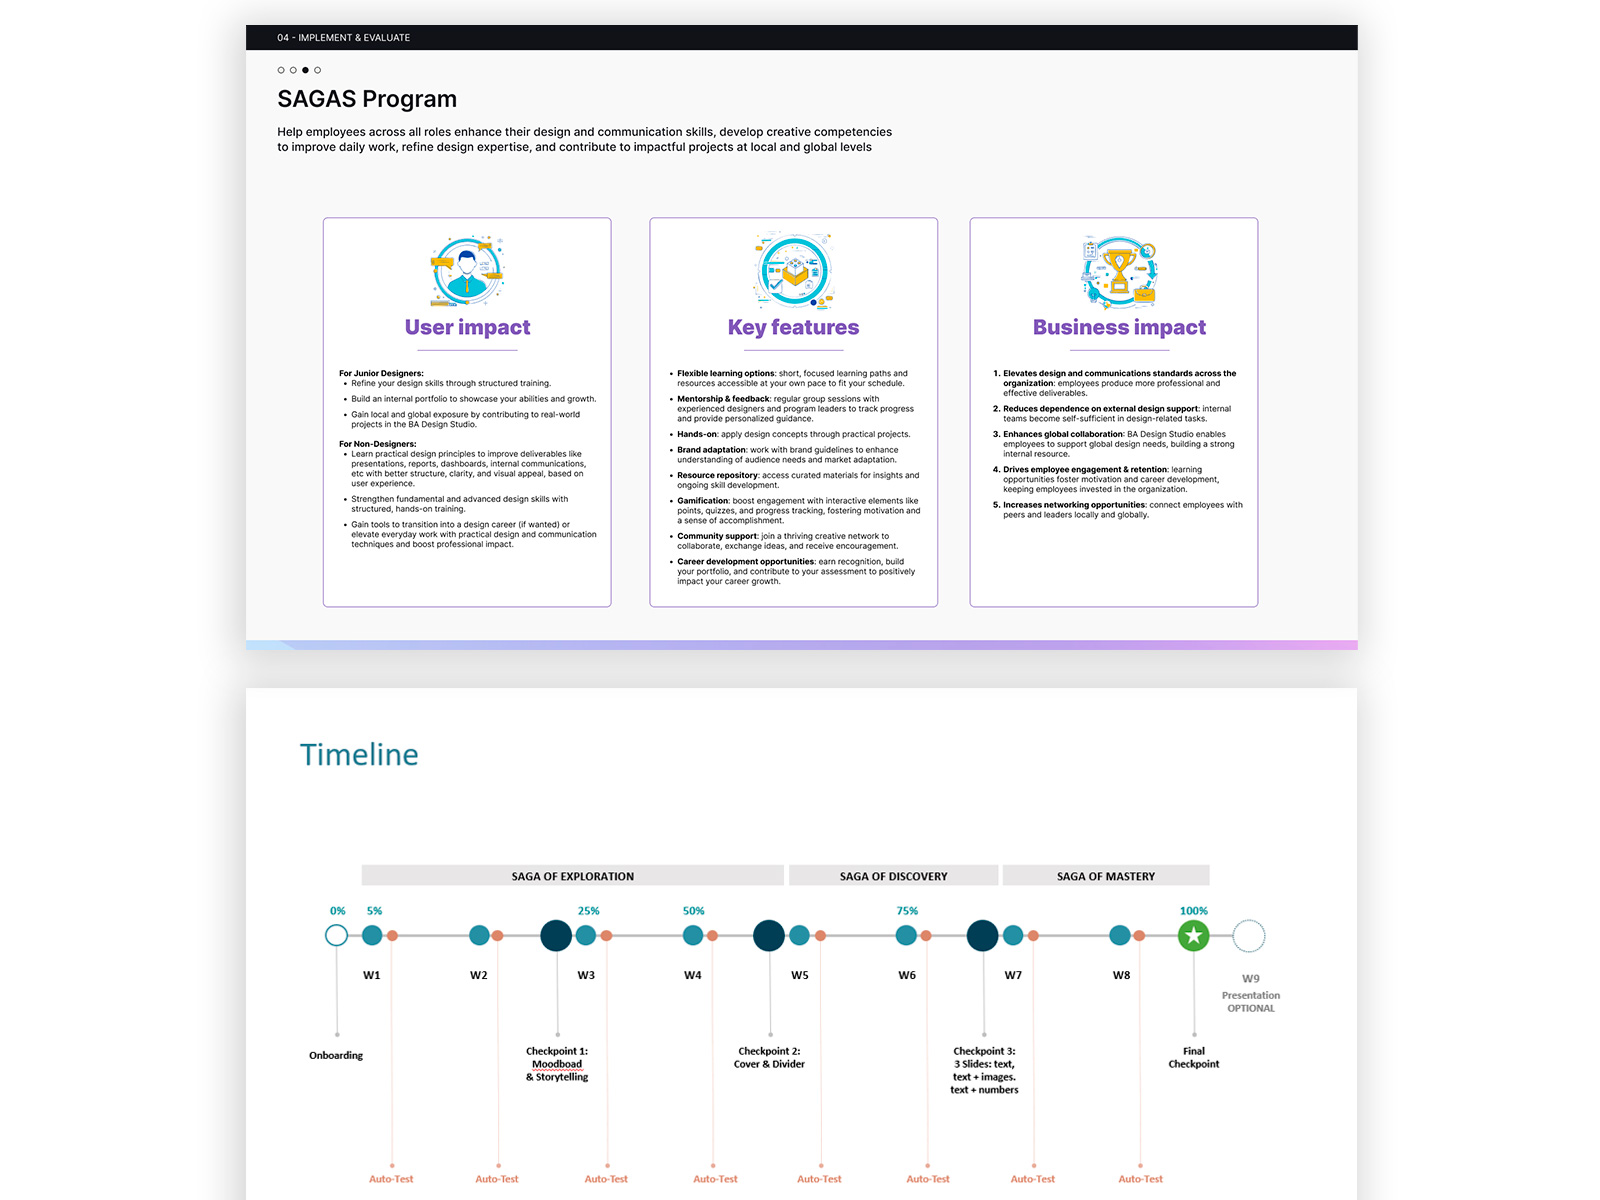
Program design and timeline — 8 weeks, 3 sagas. The program summary covers user impact, key features, and business impact: structured learning paths, gamification, mentorship, and career development opportunities for designers and non-designers alike. The timeline maps the full journey across three sagas and eight weeks, with checkpoints at weeks 3, 5, and 7 and an optional final presentation at week 9. A reduced version of this timeline appears on every slide so participants always know where they are in the process. The program was designed to scale from the Buenos Aires design community to 200+ members and adapt to other organizational topics.
Launched. Validated. Designed to scale.
The pilot launched with real participants and ran for several weeks. Initial feedback was strongly positive: participants responded well to the micro-learning structure, the gamification system, and the collaborative checkpoint format. The program is designed to scale first to approximately 200 members of the design community, then to be adapted for other organizational topics such as Procurement and Agile.